



Ask 1,107 people what they want from a home abroad and they’ll tell you in detail. The region, the number of bedrooms, whether you can walk to the bakery. Ask how they’re getting the visa or moving the money, and the room goes quiet.
That’s this year’s overseas property buyer survey in a sentence. The dream is specific. The admin is theoretical. And the gap between the two turns out to be the most useful thing in the whole dataset.
Running since 2017, the Your Overseas Home Annual Buyer Survey tracks the plans, dreams and desires of people who would like to buy a property overseas, retire overseas or invest overseas.
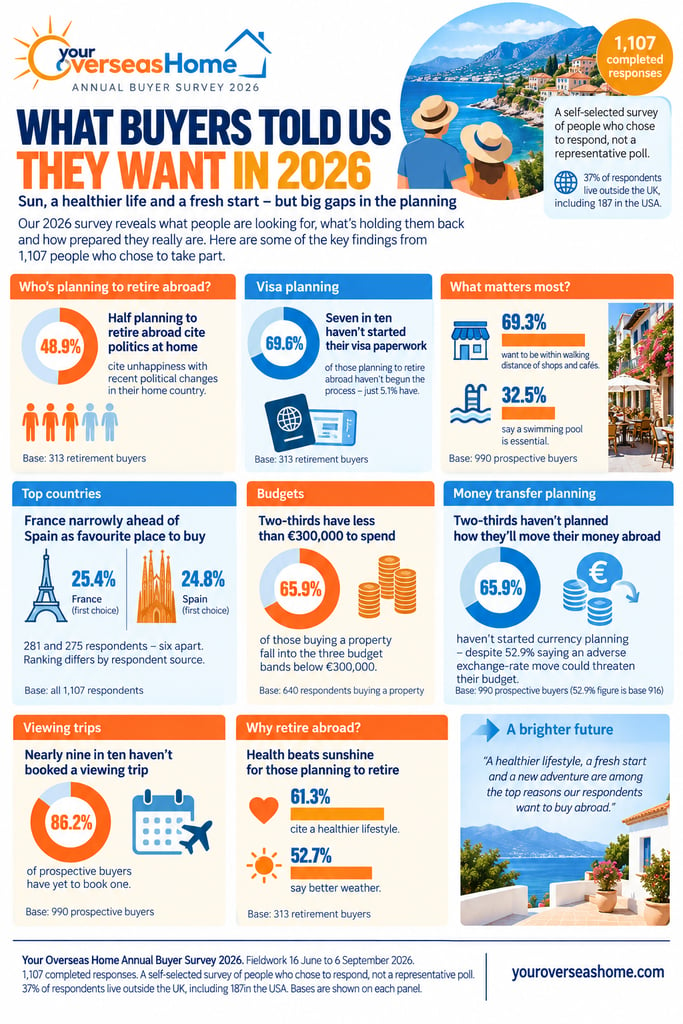
A few highlights from the 2026 survey:
- You don’t have to be rich to buy overseas – many respondents plan to use savings or property-sale proceeds.
- Ten years on, four in ten Leave-voting survey respondents say they would vote Remain today.
- Sunshine is nice, but a healthier lifestyle tops the reasons retirement respondents selected.
- Unhappiness about politics at home is one of the reasons retirement and relocation respondents give for going overseas. (The smaller US-based retirement sample was higher still.)
- France is the top choice, closely followed by Spain.
- Forget the pool: walkable shops and cafés were selected as essential more than twice as often.
- Almost half of holiday home buyers say they would work from it or might do so.
- One in five retirement respondents say they are retiring overseas on their own.
- Two-thirds of property buyers are budgeting below €300,000.
Contents
- Where buyers want to buy
- What buyers are planning
- Budgets and funding
- What worries buyers most
- What buyers want help with
- Why people are moving
- What buyers who have already bought say
- Country by country
- Where buyers go for information
- Who responded
- What should I do next?
- Summary
- Frequently asked questions
- Methodology and notes on the data
- Sources
- Infographic
Where buyers want to buy
France won. By six people. Out of 1,107 that isn’t a lead, it’s a rounding error in a beret, and we wouldn’t put a deposit on it holding next year. What the table does show properly is the daylight between those two and everyone else.
The order also depends on who answered. Among the 1,017 respondents reached through Your Overseas Home, France led by 269 to 248. Among the 90 reached through our partner audience, Spain led by 27 to 12. Treat the national ranking as close rather than settled.
Table 1: First-choice country
Base: all 1,107 respondents.
| Country | Respondents | Share |
|---|---|---|
| France | 281 | |
| Spain | 275 | |
| Italy | 134 | |
| Portugal | 122 | |
| Not sure yet | 109 | |
| Greece | 86 | |
| Other | 55 | |
| Cyprus | 45 |
The undecided group is bigger than either Greece or Cyprus. Many already have a budget and timescale, but no destination. That makes them one of the more interesting cohorts in the survey.
At region level, the most-wanted area was Nouvelle-Aquitaine. That swathe of south-west France takes in the Dordogne, Poitou-Charentes and Limousin.
It was the first choice of 73 of the 835 respondents who answered that question (8.7%). The Costa del Sol came next on 49 (5.9%). You can see what that demand looks like in stock terms on our Nouvelle-Aquitaine property listings.
Table 2: Most-wanted regions
Base: 835 prospective buyers in the six core countries.
| Region | Respondents | Share |
|---|---|---|
| Don’t know yet | 137 | |
| Nouvelle-Aquitaine (France) | 73 | |
| Costa del Sol (Spain) | 49 | |
| Costa Blanca (Spain) | 47 | |
| Provence-Alpes-Côte d’Azur (France) | 34 | |
| Occitanie (France) | 31 | |
| Paphos (Cyprus) | 27 | |
| Tuscany, Emilia-Romagna and Umbria (Italy) | 23 |
The largest single answer was “don’t know”. One in six people with a country in mind could not yet name a region within it.
What buyers are planning
These aren’t window shoppers. Nearly six in ten intend to buy, and another fifth plan to rent first and buy once they’ve worked the place out.
Table 3: What respondents are looking to do
Base: all 1,107 respondents.
| Plan | Respondents | Share |
|---|---|---|
| Buy a property | 640 | |
| Rent first, then buy | 251 | |
| Already bought | 117 | |
| Rent only | 74 | |
| Other | 25 |
Respondents buying a property were asked what they would use it for. Retirement leads, and holiday homes account for just over a third.
Table 4: What the property is for
Base: 640 respondents buying a property.
| Purpose | Respondents | Share |
|---|---|---|
| Retirement | 313 | |
| Holiday home | 224 | |
| Relocating, but not retiring | 85 | |
| Investment only | 18 |
The investment figure is too small for any firm reading and we have not analysed it further.
On timing, a third of buyers have not settled on a date at all. In our experience that is normal. Most people fix the country first, then the region, then the date.
Table 5: When buyers plan to buy
Base: 640 respondents buying a property.
| Timing | Respondents | Share |
|---|---|---|
| Not sure yet | 224 | |
| Late 2027 or beyond | 196 | |
| First half of 2027 | 112 | |
| By the end of 2026 | 84 | |
| By the end of summer 2026 | 24 |
Budgets and funding
Forget the infinity pool. Four in ten of those buying a property are working below €200,000 (275 of 640, 43.0%) and two-thirds below €300,000, which buys plenty in rural Italy and a small flat in Lisbon, where our own listings start around €190,000.
Sterling figures are approximate and move with the rate. On 11 September 2026 the European Central Bank reference rate put €200,000 at about £172,000.
Table 6: Property purchase budget
Base: 640 respondents buying a property.
| Budget | Respondents | Share |
|---|---|---|
| Under €100,000 | 102 | |
| €100,000 to €199,999 | 173 | |
| €200,000 to €299,999 | 147 | |
| €300,000 to €399,999 | 86 | |
| €400,000 to €499,999 | 50 | |
| €500,000 to €749,999 | 40 | |
| €750,000 to €1m | 16 | |
| Over €1m | 6 | |
| Over €2m | 2 | |
| Prefer not to say | 18 |
Two-thirds of those buying a property (422 of 640, 65.9%) are working below €300,000. That is worth holding in mind against the property coverage this market usually attracts.
Most of that money comes from savings or a property sale. Only a small minority plan to borrow. Our guide to mortgages when buying property abroad covers what lenders abroad will and won’t do for non-residents.
Table 7: How the purchase will be funded. Multiple answers allowed, so shares total more than 100%
Base: 640 respondents buying a property.
| Source | Respondents | Share |
|---|---|---|
| Savings | 269 | |
| Sale of a property not yet on the market | 263 | |
| Cashing in a pension or investments | 94 | |
| Mortgage | 62 | |
| Sale of a property currently on the market | 58 | |
| Sale of a property already sold | 54 | |
| Equity release | 27 |
Four in ten buyers are funding the purchase from a home they have not yet put up for sale. Their overseas plans sit behind a domestic sale they have not started. That sequencing is what makes the exchange rate matter.
The money is converted in one lump, often at short notice. Our page on Currency Transfer and Property Purchases Explained covers how buyers fix a rate first.
What worries buyers most
Nobody is losing sleep over the house. The top three worries are paperwork, borders and time, which are precisely the three things a viewing trip can’t fix. Prospective buyers could pick as many concerns as applied.
Table 8: Concerns about buying overseas. Multiple answers allowed
Base: 990 prospective buyers.
| Concern | Respondents | Share |
|---|---|---|
| Getting a visa to live there | 420 | |
| The legal process is confusing and worrying | 386 | |
| The 90-day rule limiting time there | 338 | |
| Affordable healthcare | 283 | |
| Have not finalised where to buy | 279 | |
| Wanting to keep a home in their own country too | 239 | |
| How children will inherit | 168 | |
| Not knowing how to get finance or a mortgage | 152 | |
| Currency weakening mid-purchase | 138 | |
| Persuading a spouse or partner | 86 | |
| No concerns | 87 |
The top three all concern time and paperwork rather than property. The 90-day limit applies to non-EU nationals visiting the Schengen area. The European Commission publishes a short-stay calculator that counts the rolling 180-day window properly. Our article on staying longer than 90 days as a buyer in Spain covers the residence routes people use instead.
Healthcare sits fourth. For state pensioners moving within the EEA, cover often runs through the S1 route, and country detail sits in our guides to Spanish healthcare and healthcare in Portugal. Our guide to the S1 form explains how that works. The UK government’s guidance on moving, living or retiring abroad covers the pension and tax side.
Inheritance worries 168 respondents, and it is one of the areas where the rules are not what people assume. Succession in most EU countries follows the law of the country where you last lived. The European Commission’s guidance on planning a cross-border inheritance explains how to choose the law of your nationality instead. Our piece on forced heirship and inheritance law shows what that means for children from an earlier marriage.
Find a webinar for your plans
Choose what you need help with and when you want to attend. We will take you straight to the most relevant upcoming events.
Currency sits near the bottom of that list when buyers name concerns unprompted. Asked about it directly, the picture changes. Of 916 respondents, 485 (52.9%) said an adverse rate movement would hurt their budget. A further 277 (30.2%) were not sure, and only 154 (16.8%) said they would be fine. Our guide to minimising currency risk on an overseas purchase covers the tools buyers use.
Meanwhile 652 of 990 prospective buyers (65.9%) had not started planning how to move their money. The gap between “it would hurt me” and “it worries me” is one of the clearest patterns here.
What buyers want help with
Buyers want two things, and they want them almost equally: something to read and someone to ring. Two percentage points separate guides from expert introductions, which makes this the clearest commercial signal in the survey.
Table 9: Specialist introductions buyers would like. Multiple answers allowed
Base: 990 prospective buyers.
| Introduction wanted | Respondents | Share |
|---|---|---|
| A trusted estate agent | 515 | |
| A trusted overseas lawyer | 506 | |
| An immigration and visa specialist | 360 | |
| A tax and financial adviser | 338 | |
| A health insurance company | 293 | |
| Other buyers who have already bought there | 263 | |
| A currency specialist | 171 | |
| A mortgage broker | 130 | |
| A property developer | 107 | |
| None of these | 153 |
Just over a quarter want to talk to other buyers who have already done it. Most portals do not offer that. Half want an agent and half want a lawyer, and those two together are what our property consultants arrange.
On viewing trips, 137 of 990 (13.8%) had booked one. Another 190 (19.2%) wanted to speak to a viewing trip specialist. Our tips for a viewing trip in France and Italy cover how the prepared ones use the time.
Why people are moving
Health beat weather. In a survey about buying somewhere sunny, that’s quite something: a healthier lifestyle came out ahead of better weather among the 313 people buying for retirement. They could pick as many reasons as applied.
Table 10: Motivations for retiring overseas. Multiple answers allowed
Base: 313 retirement buyers.
| Motivation | Respondents | Share |
|---|---|---|
| A healthier lifestyle | 192 | |
| Better weather | 165 | |
| Unhappy with recent political changes at home | 153 | |
| A lower cost of living | 133 | |
| A new adventure | 122 | |
| A place to welcome family and friends | 94 | |
| To make new friends | 47 | |
| Lower taxes | 35 |
Politics ranks third, 6.4 points ahead of a lower cost of living, which our cost of living overseas index for 2026 puts into numbers. The survey records what people selected as a motivation. It cannot show what caused anyone’s decision, and we make no claim that it does.
The pattern repeats among people relocating without retiring. Of 85, 43 (50.6%) selected political change, behind a healthier lifestyle (60) and a new adventure (51).
Holiday-home buyers are driven by something simpler. Of 224, 128 (57.1%) chose an easy escape and home from home. Another 60 (26.8%) wanted lifestyle plus investment and 52 (23.2%) wanted time with family and friends.
On letting it out, 68 (30.4%) would lend it to family and friends only. A further 65 (29.0%) would not let it at all, and 34 (15.2%) would let commercially.
Two other findings sit alongside these. Of 313 retirement buyers, 218 (69.6%) had not started a visa application. And 240 (76.7%) are retiring as a couple, with 65 (20.8%) going on their own. Our guide to retirement planning overseas is written for both.
What buyers who have already bought say
Here’s the reassuring bit. The people who’ve actually done it are the least frightened of it, which suggests the fear peaks just before the paperwork starts.
Some 117 respondents have already bought, and their answers are a useful counterweight to the worries above. They completed a purchase, so they are a self-selecting group.
Table 11: Fear against experience
| Prospective buyers (base 990) | Owners who have bought (base 117) |
|---|---|
| 386 (39.0%) say the legal process is confusing and worrying | 102 (87.2%) found the process quite or very easy |
| 506 (51.1%) want an introduction to a trusted lawyer | 97 (82.9%) were fairly or very confident in their legal representation |
| 515 (52.0%) want an introduction to a trusted estate agent | 90 (76.9%) found their agent quite or extremely helpful |
The practical detail is reassuring too. Of 117 owners, 78 (66.7%) bought after two viewing trips or fewer. And 77 (65.8%) viewed ten properties or fewer before choosing.
Two gaps show up. Only six of 117 owners (5.1%) said their estate agent advised them on currency risk. Just 32 (27.4%) used a forward contract to fix their rate. Of those who used a currency company, 85 (72.6%) would recommend it.
Concerns also change after completion. Process worries give way to money and residency. Income and pensions now worry 41 of 117 (35.0%), keeping a visa 34 (29.1%) and inheritance 30 (25.6%). Our piece on UK inheritance tax and moving overseas covers the last of those. A third (42, 35.9%) have no concerns at all, and 68 (58.1%) would not consider selling up and moving back.
Country by country
Six countries, six shopping lists. France wants an old house with a garden. Spain wants a pavement and a pool. Italy wants a holiday home and a word with a lawyer.
Bases vary between countries, so the depth of each chapter varies with them. Greece and Cyprus have smaller samples and we have flagged where that matters.
Compare the six countries
Pick a country to see its profile. Bases differ by question and are shown on each row.
France 281 respondents, 25.4% of 1,107
The only country where a countryside home leads: 165 of 250 prospective buyers (66.0%).
Spain 275 respondents, 24.8% of 1,107
Highest pool demand anywhere in the survey: 111 of 238 (46.6%).
Italy 134 respondents, 12.1% of 1,107
Only country where holiday homes outrank retirement, and the sharpest legal-process concern in the survey.
Portugal 122 respondents, 11.0% of 1,107
Most retirement-weighted market in the survey. Algarve figure pending confirmation against the stats cube.
Greece 86 respondents, 7.8% of 1,107
Youngest audience of the six, and the most coastal brief: 61 of 82 (74.4%) want a seaside home.
Cyprus 45 respondents, 4.1% of 1,107
Small sample. Treat these figures as directional, not precise.
Sharpest regional concentration in the survey, and the readiest buyers on both viewing trips and currency.
France

France is where people mean it. Seven in ten are buying rather than renting first or still deciding, the highest share of committed buyers anywhere in the survey: 197 of 281 (70.1%), from a first-choice total of 281 (25.4% of 1,107). Our guide to buying property in France covers the process those buyers are about to start.
It is also the relocation destination. Of the 85 people relocating without retiring, 35 chose France. That is 17.8% of French buyers, against 13.3% overall.
Table 12: France at a glance
| Measure | Finding | Base |
|---|---|---|
| Share of all respondents | 281 (25.4%) | 1,107 |
| Buying a property | 197 (70.1%) | 281 |
| Most common purpose | Retirement, 98 (49.7%) | 197 |
| Most-wanted region | Nouvelle-Aquitaine, 73 (29.2%) | 250 |
| Most common budget | €100,000 to €199,999, 59 (29.9%) | 197 |
| Top concern | Getting a visa, 110 (44.0%) | 250 |
| Started currency planning | 92 (36.8%) | 250 |
French property tastes are distinct. Of 250 prospective buyers, 165 (66.0%) want a countryside home and 151 (60.4%) a village home. Only 78 (31.2%) are looking at the coast.
Almost half, 118 (47.2%), say “old and beautiful” is essential, well above the 33.2% across all 990 prospective buyers. A garden or terrace matters most of all, named by 200 (80.0%).
On shortlists, Occitanie is the most-considered second region (61 of 250, 24.4%), followed by Brittany (43, 17.2%). Our region-by-region look at where to buy in France goes through both.
French buyers ask about inheritance because French law reserves a share of an estate for children. Our guide to French inheritance law for buyers in France explains the options.
What next: browse property for sale in France to see what these budgets buy.
Spain

Spain is the walking country. Nearly four in five want shops and cafés on foot, which is an awkward brief for a villa halfway up a hill.
Spain was the first choice of 275 respondents (24.8%), six behind France, and produced the largest single group planning to rent before buying, at 70 of 275 (25.5%).
Table 13: Spain at a glance
| Measure | Finding | Base |
|---|---|---|
| Share of all respondents | 275 (24.8%) | 1,107 |
| Buying a property | 151 (54.9%) | 275 |
| Most common purpose | Retirement, 78 (51.7%) | 151 |
| Most-wanted region | Costa del Sol, 49 (20.6%) | 238 |
| Most common budget | €200,000 to €299,999, 47 (31.1%) | 151 |
| Top concern | Getting a visa, 99 (41.6%) | 238 |
| Started currency planning | 80 (33.6%) | 238 |
Spanish budgets run slightly higher than French ones, with the modal band one step up the scale. The brief is coastal and walkable.
Of 238 prospective buyers, 142 (59.7%) want a seaside home. Walking distance to shops and cafés matters to 187 (78.6%), and a pool to 111 (46.6%), the highest among the larger country sampled. Our step-by-step guide to buying property in Spain sets out the order those decisions come in.
Spanish visa routes are set out in our guide to residency and visa options in Spain, and how to retire to Spain covers the rest of the move.
Cost of living does more work in Spain than elsewhere. Among 78 Spanish retirement buyers, 44 (56.4%) selected a lower cost of living, against 42.5% across all 313 retirement buyers.
The shortlist data is worth a look for anyone selling in Catalonia. The Costa Brava was the first choice of only four of 238 (1.7%). But 34 (14.3%) named it as a region they would consider.
What next: see property for sale in Spain, or narrow it down with listings in Alicante province on the Costa Blanca.
Speak to a Spain property expert
Italy

Italy is the only country where the holiday home wins, and where legal worries are strongest. Of 134 first-choice respondents (12.1%), 45 of the 79 buyers (57.0%) want a second home rather than a retirement.
It is also where the legal process worries people most. Of 118 Italian prospective buyers, 64 (54.2%) named it a concern, 15.2 points above the 39.0% across all 990. Our walk-through of the property buying process in Italy covers most of what sits behind that worry. The notary’s role in an Italian purchase explains the rest.
Table 14: Italy at a glance
| Measure | Finding | Base |
|---|---|---|
| Share of all respondents | 134 (12.1%) | 1,107 |
| Buying a property | 79 (59.0%) | 134 |
| Most common purpose | Holiday home, 45 (57.0%) | 79 |
| Most-wanted region | Tuscany, Emilia-Romagna and Umbria, 23 (19.5%) | 118 |
| Most common budget | €100,000 to €199,999, 26 (32.9%) | 79 |
| Top concern | The legal process, 64 (54.2%) | 118 |
| Started currency planning | 28 (23.7%) | 118 |
Italy draws the most international audience of any country. Of 134 respondents, 68 (50.7%) live in the UK and 35 (26.1%) in the USA. It also attracts the most first-timers: 103 of 118 (87.3%) have never owned a property overseas. Our province-by-province guide to Tuscany is the usual starting point.
Budgets skew lower, with 45 of 79 (57.0%) under €200,000, and interest spreads across the country rather than concentrating. Central northern Italy leads on 23 (19.5%). The Rome, Lazio, Marche and Abruzzo group follows on 22 (18.6%), then the north west on 19 (16.1%).
What next: compare property for sale in Italy with listings in Tuscany.
Portugal

Portugal is where people go to stop working. More than half its buyers are buying for retirement, the highest share in the survey: 34 of 60 (56.7%), from 122 first-choice respondents (11.0%). It also has the highest proportion planning to rent before buying, at 37 of 122 (30.3%).
Table 15: Portugal at a glance
| Measure | Finding | Base |
|---|---|---|
| Share of all respondents | 122 (11.0%) | 1,107 |
| Buying a property | 60 (49.2%) | 122 |
| Most common purpose | Retirement, 34 (56.7%) | 60 |
| Most-wanted area | The Algarve, all sections combined, 28 (26.2%) | 107 |
| Most common budget | €200,000 to €299,999, 16 (26.7%) | 60 |
| Top concern | Getting a visa, 50 (46.7%) | 107 |
| Started currency planning | 41 (38.3%) | 107 |
The Algarve remains the draw, though its sections split the vote. Of 107 prospective buyers, 10 named the west, 10 the centre and eight the east. Porto leads the individual options on 13 (12.1%), with inland central Portugal on 11 (10.3%).
More Portuguese buyers than average do not know how to arrange finance: 22 of 107 (20.6%), against 15.4% overall. The legal requirements of buying property in Portugal is the piece most of them start with.
Our guides to how to retire to Portugal and where to buy in Portugal region by region cover both halves of that decision.
Among the 34 Portuguese retirement buyers, political change was the most-selected motivation, chosen by 20 (58.8%). That base is small, so treat it as directional rather than settled.
What next: see property for sale in the Algarve, then read our guide to planning a viewing trip in Portugal.
Greece

In Greece a view isn’t a bonus, it’s the brief: eight in ten call one essential. Greece brings in younger buyers and some of the firmest intentions, with 55 of 86 first-choice respondents (64.0%) buying rather than renting or still deciding.
Table 16: Greece at a glance
| Measure | Finding | Base |
|---|---|---|
| Share of all respondents | 86 (7.8%) | 1,107 |
| Buying a property | 55 (64.0%) | 86 |
| Most common purpose | Retirement, 25 (45.5%) | 55 |
| Most-wanted region | Crete, 20 (24.4%) | 82 |
| Most common budget | €100,000 to €199,999, 17 (30.9%) | 55 |
| Top concern | The legal process, 36 (43.9%) | 82 |
| Started currency planning | 27 (32.9%) | 82 |
Greece attracts the youngest audience of the six. Of 86 respondents, 13 (15.1%) are aged 40 to 49 and 28 (32.6%) are 50 to 59. Across all 1,107 those shares are 6.8% and 25.0%.
The property brief is the most coastal and view-driven anywhere in the survey. Of 82 prospective buyers, 61 (74.4%) want a seaside home and 65 (79.3%) call a view essential. Crete and the Ionian islands take the top two regional spots.
The Peloponnese is the most popular second choice (22, 26.8%). Our guide to where to buy in Crete covers the leading region in detail. Our step-by-step guide to buying a home in Greece covers the legal sequence that worries this group most.
What next: browse property for sale in Crete, or read how to retire to Greece for the visa and healthcare side.
Cyprus

Cyprus buyers have made their minds up. Two-thirds said Paphos and a quarter have already booked a viewing trip, which is the readiest group in the survey. All of it comes from 45 respondents (4.1%) though, so take this chapter gently: the figures are directional rather than precise.
What stands out is how decided these buyers are. Of 40 Cypriot prospective buyers, 27 (67.5%) named Paphos as their first choice, the sharpest regional concentration in the survey. Ten of 40 (25.0%) have already booked a viewing trip, against 13.8% across all 990. And 17 (42.5%) have started currency planning, against 34.1% overall.
Table 17: Cyprus at a glance. Small sample, treat as directional
| Measure | Finding | Base |
|---|---|---|
| Share of all respondents | 45 (4.1%) | 1,107 |
| Buying a property | 28 (62.2%) | 45 |
| Most-wanted region | Paphos, 27 (67.5%) | 40 |
| Top concerns | The 90-day rule, 15 (37.5%); visas, the legal process and healthcare, 14 each (35.0%) | 40 |
| Viewing trip booked | 10 (25.0%) | 40 |
| Live in the UK | 40 (88.9%) | 45 |
Cyprus has by far the most UK-based audience, at 40 of 45 (88.9%). Our guide to where to buy in Cyprus goes beyond Paphos. Pools feature heavily: 25 of 40 (62.5%) call one essential, roughly double the survey-wide 32.5%. Title deeds are the other Cyprus-specific question, and our explainer on how the Cyprus buying process works deals with it.
What next: see property for sale in Paphos and our pick of the best places to retire to in Cyprus.
Buyers with no country yet
Then there are the 109 people (9.8%) with a budget, a timescale and absolutely no idea where. They’re as serious as anyone else: 49 of 109 (45.0%) are buying and 33 (30.3%) plan to rent first.
They are further back in the process, though. Only five of 108 (4.6%) have booked a viewing trip. Another 45 (41.7%) have not finalised where to buy, and 76 (70.4%) have not started currency planning. Visas are their biggest worry, named by 53 (49.1%).
They read more than they browse: 72 of 109 (66.1%) have used our articles, ahead of guides on 64 (58.7%).
What next: search property for sale by country to get a feel for prices, or join a webinar and hear from buyers who have already chosen.
Where buyers go for information
AI came last. Not nearly last, last, behind the telly. Respondents were asked which sources are most useful to overseas buyers and could pick as many as applied.
Table 18: Best sources of information and help. Multiple answers allowed
Base: all 1,107 respondents.
| Source | Respondents | Share |
|---|---|---|
| Downloadable guides | 743 | |
| Introductions to trusted local experts | 720 | |
| Webinars and podcasts | 403 | |
| A one-to-one appointment with a consultant | 373 | |
| Television shows about buying overseas | 373 | |
| YouTube videos | 312 | |
| Property exhibitions | 235 | |
| Asking AI tools such as ChatGPT or Claude | 152 |
Tools like ChatGPT, Claude or Google’s AI search and Gemini were only chosen by 152 of 1,107 (13.7%). That figure is flat across age bands rather than concentrated among younger respondents. Guides and human introductions are chosen roughly five times more often.
On the portal itself, buyers are clear about what is missing.
Table 19: Portal features buyers would like. Multiple answers allowed
Base: all 1,107 respondents.
| Feature | Respondents | Share |
|---|---|---|
| Neighbourhood information | 661 | |
| Better search filters | 553 | |
| Price history data | 487 | |
| A property comparison tool | 437 | |
| Virtual tour integration | 262 | |
| Saved search alerts | 255 | |
| A mobile app | 208 | |
| School and amenities data | 119 |
Neighbourhood information tops that list in every country we cover. It reads as much like a request for area guides as for portal features.
On virtual events, the appeal is practical. Of 1,107 respondents, 766 (69.2%) value saving travel time and 575 (51.9%) want recordings later. A further 460 (41.6%) do not live near the usual exhibitions.
Only 256 (23.1%) have attended a property exhibition, virtual or in person. Check out our on-demand webinars if you want to find out more about buying overseas.
For webinars, 635 (57.4%) have no day preference. Among those who do, Sunday (209, 18.9%) and Saturday (174, 15.7%) lead. Evenings are the most popular slot (318, 28.7%).
We also asked how likely people would be to recommend Your Overseas Home, on a scale of one to ten. The mean score was 7.67 (base 1,107), and 448 respondents (40.5%) scored nine or ten.
Who responded
Two-thirds of respondents live in the UK. The other third is why we don’t call this a survey of British buyers.
Table 20: Respondent profile
Base: all 1,107 respondents.
| Measure | Finding |
|---|---|
| Aged 60 to 69 | 476 (43.0%) |
| Aged 50 to 59 | 277 (25.0%) |
| Aged 70 to 80 | 198 (17.9%) |
| Aged under 50 | 100 (9.0%) |
| Live in the UK | 698 (63.1%) |
| Live in the USA | 187 (16.9%) |
| Live in Ireland | 22 (2.0%) |
| Have owned a property overseas before | 202 of 990 (20.4%) |
The USA was the second-largest group responding to the survey questions. This is not a British sample and we have not written it up as one.
We also asked, ten years on from the referendum, how respondents view the Brexit vote today.
Table 21: View of the Brexit vote in 2026
Base: all 1,107 respondents.
| Response | Respondents | Share |
|---|---|---|
| Voted Remain, would do so again | 417 | |
| Not British, did not vote | 292 | |
| Don’t know or would rather not say | 148 | |
| Voted Leave, would do so again | 142 | |
| Voted Leave, would now vote Remain | 100 | |
| Voted Remain, would now vote Leave | 8 |
Of the 242 respondents who voted Leave, 100 (41.3%) would now vote Remain. Of the 425 who voted Remain, eight (1.9%) would switch the other way.
What should I do next?
Wherever you sit in all this, there’s one sensible next thing to do.
- Still choosing a country. Free country guides cover costs, process and residency rules in one place, and they were the most valued resource in this survey. Start with our guide to buying property in France or the Spain equivalent.
- Country chosen, region undecided. You are in the largest single group in Table 2. Area guides and our next virtual event are built for this stage.
- Region chosen, ready to look. We can introduce you to vetted agents and lawyers in your area, which is what half the people in this survey asked for. Speak to a property consultant.
- Budget to protect. More than half of buyers said an exchange rate movement would hurt their budget and two-thirds had not planned for it. Our page on Currency Transfer and Property Purchases Explained is the place to start, and a conversation with a currency specialist costs nothing.
Summary
- France (281, 25.4%) narrowly led Spain (275, 24.8%) as first-choice destination among 1,107 respondents.
- Retirement is the most common reason to buy, at 313 of 640 buyers (48.9%), and political change was the third most-selected motivation for retiring abroad (153, 48.9%).
- The most common budget is €100,000 to €199,999 (173 of 640, 27.0%), with 43.0% of buyers below €200,000.
- Visas (420, 42.4%) and the legal process (386, 39.0%) are the leading concerns among 990 prospective buyers.
- Owners who have completed a purchase report a far easier time than prospective buyers expect, with 102 of 117 (87.2%) finding the process easy.
- Buyers want guides and human introductions far more than AI: 743 chose guides and 720 chose expert introductions, against 152 for AI tools, out of 1,107.
- Preparation lags intent. 853 of 990 (86.2%) have not booked a viewing trip and 652 (65.9%) have not started currency planning.
Frequently asked questions
Among 1,107 respondents to our 2026 survey, France was the most popular first choice on 281 (25.4%). Spain came second on 275 (24.8%), then Italy (134), Portugal (122), Greece (86) and Cyprus (45). At regional level, Nouvelle-Aquitaine in south-west France was the most-wanted area, chosen by 73 of 835 respondents (8.7%). The Costa del Sol and Costa Blanca followed, on 49 and 47.
We report budgets in bands rather than as an average, because averaging banded data hides the assumptions behind it. Among 640 respondents buying a property, the most common band was €100,000 to €199,999 (173, 27.0%). Next came €200,000 to €299,999 (147, 23.0%). Just over four in ten buyers (43.0%) are working below €200,000, and two-thirds (65.9%) below €300,000.
Getting a visa was the most common concern, named by 420 of 990 prospective buyers (42.4%). The legal process followed on 386 (39.0%), then the 90-day rule on 338 (34.1%). Healthcare (283, 28.6%) and not having settled on a location (279, 28.2%) also feature strongly. Buyers could select as many concerns as applied, so the shares total more than 100%.
Our data suggests the fear runs ahead of the reality. Some 386 of 990 prospective buyers (39.0%) said the legal process worried them, against 102 of the 117 who had already bought (87.2%) describing it as quite or very easy. Another 97 (82.9%) felt confident in their legal representation. Those owners completed their purchases, so they are a self-selecting group.
Of 117 owners who had already bought, 78 (66.7%) found their property after two viewing trips or fewer, and 77 (65.8%) viewed ten properties or fewer. Around three in ten (34, 29.1%) needed just one trip. Those numbers suggest a well-prepared shortlist matters more than the number of trips you take, which is where our area guides and webinars earn their place.
Rarely, on this evidence. Asked which sources are most useful, 152 of 1,107 respondents (13.7%) chose AI tools such as ChatGPT or Claude. Downloadable guides (743, 67.1%) and introductions to trusted local professionals (720, 65.0%) came up roughly five times more often, and webinars and podcasts came third on 403 (36.4%). AI use was flat across every age band we can report.
Methodology and notes on the data
The short version: 1,107 people completed the survey between 16 June and 6 September 2026. It is a self-selected survey of people who chose to respond, not a representative poll. The survey branched, so bases differ by question and the base for each figure is shown with it. We ran no significance tests.
Full methodology and notes on the data
Who took part. 1,107 unique respondents completed the survey. They were reached through Your Overseas Home’s own audience and through one external partner audience. This is a self-selected survey of people who chose to respond, not a representative poll. Findings describe respondents to this survey. They do not describe all overseas buyers, or buyers of any one nationality. Just under two-thirds (698, 63.1%) live in the UK, and 187 (16.9%) live in the USA.
Respondent source. 1,017 respondents came through Your Overseas Home and 90 through an external partner audience. The partner group skews older and less far along in its planning, so we have checked age, wealth and readiness findings against both groups and flagged any figure where the pattern shifts.
Fieldwork. 16 June to 6 September 2026.
How the sample is defined. A response counts as complete when the final question is answered. Internal and test responses are excluded, and where the same email address completed the survey more than once we kept the most recent submission.
Why bases vary. The survey branched, so respondents only saw questions relevant to their situation. Someone renting was not asked about purchase budgets, and someone buying a holiday home did not see the retirement questions. The base given with each table is the number of eligible respondents who gave a usable answer. It is the correct denominator for that figure. We exclude questions a respondent was not asked, or did not answer, rather than counting them as a no.
Multiple-answer questions. Where respondents could select more than one option, shares total more than 100%. These are marked in the table captions.
Sample size. We treat 100 or more responses as a firm finding and 50 to 99 as usable. Anything from 30 to 49 is directional, and below 30 is too small to report. Cyprus figures and some country-level breakdowns fall into the smaller bands and are flagged where they appear. Differences between groups are described as they stand. We ran no significance tests, so no difference here should be read as statistically significant.
Budgets. Reported in bands as respondents selected them. We have not calculated an average budget. Sterling equivalents are approximate and use the European Central Bank euro reference rate.
Comparison with previous years. This year the budget and timing questions went only to respondents buying a property, not to everyone considering a purchase. The denominator has changed. These two measures are not comparable with our earlier surveys, so we publish no year-on-year change.
Recommendation score. Respondents rated their likelihood of recommending Your Overseas Home on a scale of one to ten. The scale starts at one rather than zero. So the result is not a conventional Net Promoter Score, and it is not comparable with NPS figures elsewhere. We report the mean and the share scoring nine or ten.
Household income. Respondents reported income in several different currencies, so the income bands are not comparable across the sample. We have not reported them.
Open comments. Respondents left 5,569 free-text comments. These inform our reading of the results. We quote none of them, and attribute no comment to an individual.
Sources
- Your Overseas Home Annual Buyer Survey 2026, fieldwork 16 June to 6 September 2026, 1,107 completed responses.
- European Commission, Schengen short-stay calculator and the 90/180-day rule.
- European Commission, Schengen visa policy.
- UK government, Moving, living or retiring abroad.
- European Commission, Your Europe, Planning your cross-border inheritance in the EU.
- European Central Bank, Euro foreign exchange reference rates, pound sterling, rate of 0.8582 on 11 September 2026.
Infographic